The question almost always arrives in the same format: "I want a quote to digitize my plant." And it almost always hides a framing error that turns out to be expensive. People picture a single number —one big, one-time figure to "put in sensors and become Industry 4.0"— when the honest answer is that digitizing a plant is not a purchase, it is a sequence of decisions, and most of the real cost is not where you think it is.
This article gives the full breakdown: which layers make up the Industry 4.0 stack, what each one costs with cited market ranges, the order in which it makes sense to invest, and how to decide phase by phase instead of signing a two-year project that nobody can predict. To ground it, we use as a reference —anonymized— a real project we ran for a plant that manufactures pallets and packaging in the State of Mexico.
A note of honesty from the very first paragraph: what we did at that plant was the data layer —ERP, integrations, and training—, not sensors or robots. When this text discusses IoT, MES, or line automation, the prices come from third-party public benchmarks, clearly labeled. We are not going to present as our own what we did not do.
1. What "digitizing" a plant means (and why the order matters)
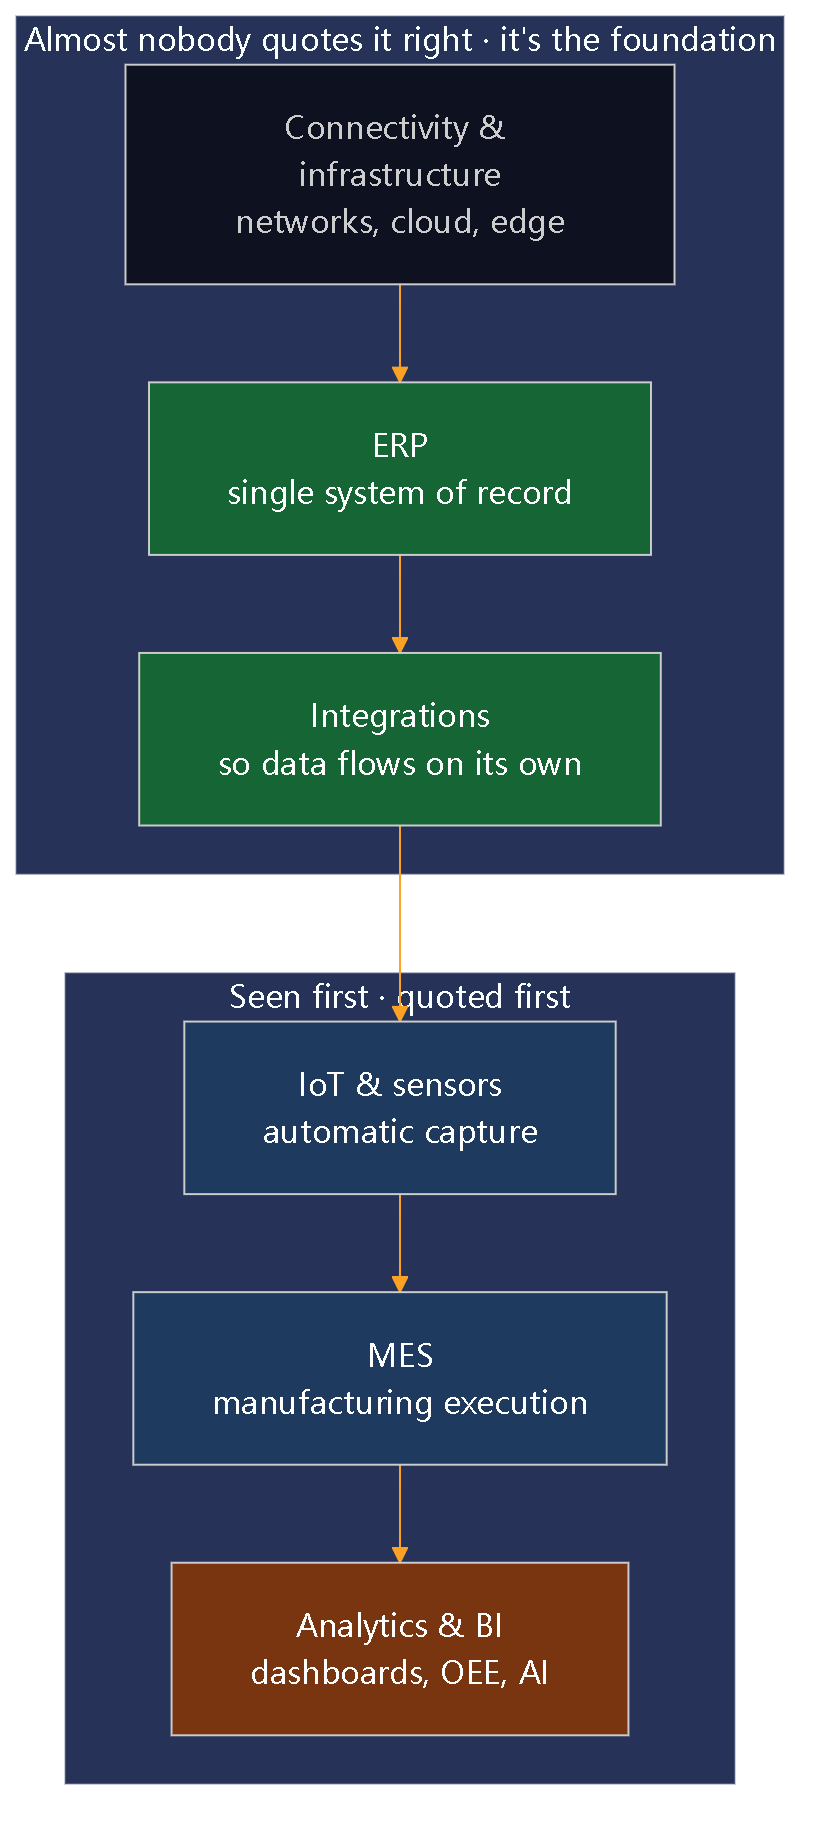
"Industry 4.0" is a label that spans six layers that are very different in cost and difficulty. The most common —and most expensive— mistake is to start at the top: buying sensors and flashy dashboards before having a system that reliably records what is produced, what is purchased, and what it costs.
View Mermaid diagram
flowchart TD
    subgraph TOP["Seen first · quoted first"]
        L6["Analytics & BI
dashboards, OEE, AI"]
        L5["MES
manufacturing execution"]
        L4["IoT & sensors
automatic capture"]
    end
    subgraph BASE["Almost nobody quotes it right · it's the foundation"]
        L3["Integrations
so data flows on its own"]
        L2["ERP
single system of record"]
        L1["Connectivity & infrastructure
networks, cloud, edge"]
    end

    L1 --> L2 --> L3 --> L4 --> L5 --> L6

    style L2 fill:#166534,color:#fff
    style L3 fill:#166534,color:#fff
    style L4 fill:#1e3a5f,color:#fff
    style L5 fill:#1e3a5f,color:#fff
    style L6 fill:#78350f,color:#fff
The rule we repeat to every industrial client: a plant that does not have its inventory reconciled and its production recorded is not ready for IoT. Putting sensors on a process still run in Excel is automating the generation of bad data. First the system of record (ERP), then getting the data to flow on its own (integrations), and only then do automatic capture (IoT) and shop-floor execution (MES) have something solid to stand on.
2. The cost breakdown: where the money really is
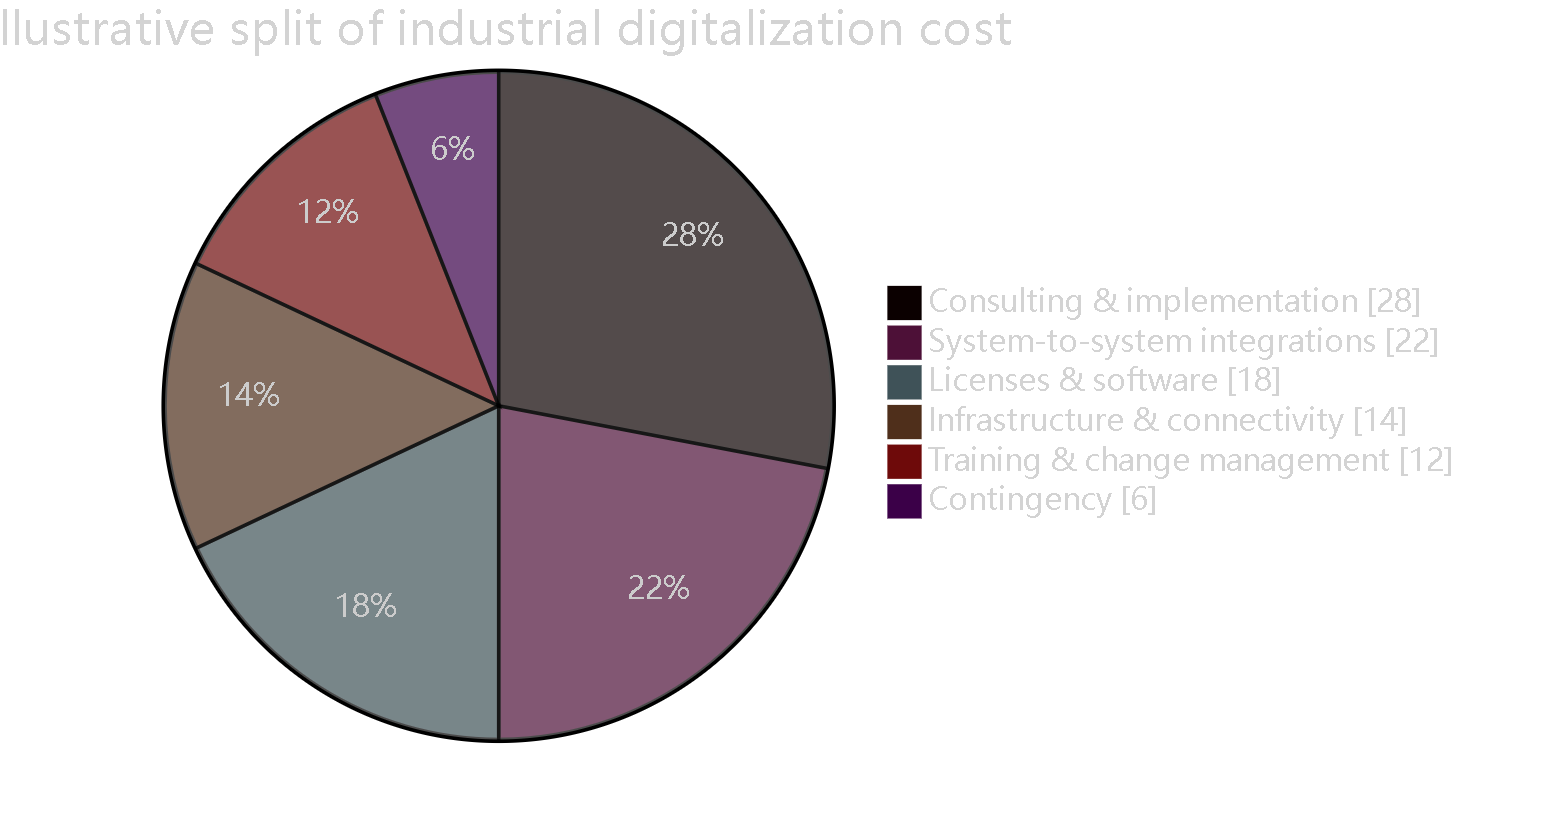
When an operations director asks "how much does it cost," they almost always budget the software and the hardware and treat the rest as "extras." Market benchmarks say the opposite: hardware is rarely the dominant line item, and what gets underestimated —integration and change management— is exactly what derails the budget.
View Mermaid diagram
pie showData
    title Illustrative split of industrial digitalization cost
    "Consulting & implementation" : 28
    "System-to-system integrations" : 22
    "Licenses & software" : 18
    "Infrastructure & connectivity" : 14
    "Training & change management" : 12
    "Contingency" : 6
Three market findings worth being clear on before signing anything:
- Hardware is not 80% of the cost. In IoT deployments, "software, connectivity, and integration services frequently make up the majority of project spend," not the sensors (Intuz). Budgeting only sensors and PLCs underestimates the project by multiples.
- Integration is a cost line, not a free extra. In MES systems, integration accounts for 20–40% of total cost (Deloitte, cited by ScienceSoft), and each system-to-system connection adds 10–20% per year of perpetual maintenance (Percengage).
- Change management is the most underestimated item. Organizations allocate, on average, less than 12% to the human side, even though culture and adoption are the number-one cause of failure; overruns come from "change management, extended training cycles, and the productivity dip at go-live" (Opsio). Reserve 8–15% at a minimum.
3. The cost-per-module: what gets quoted, layer by layer
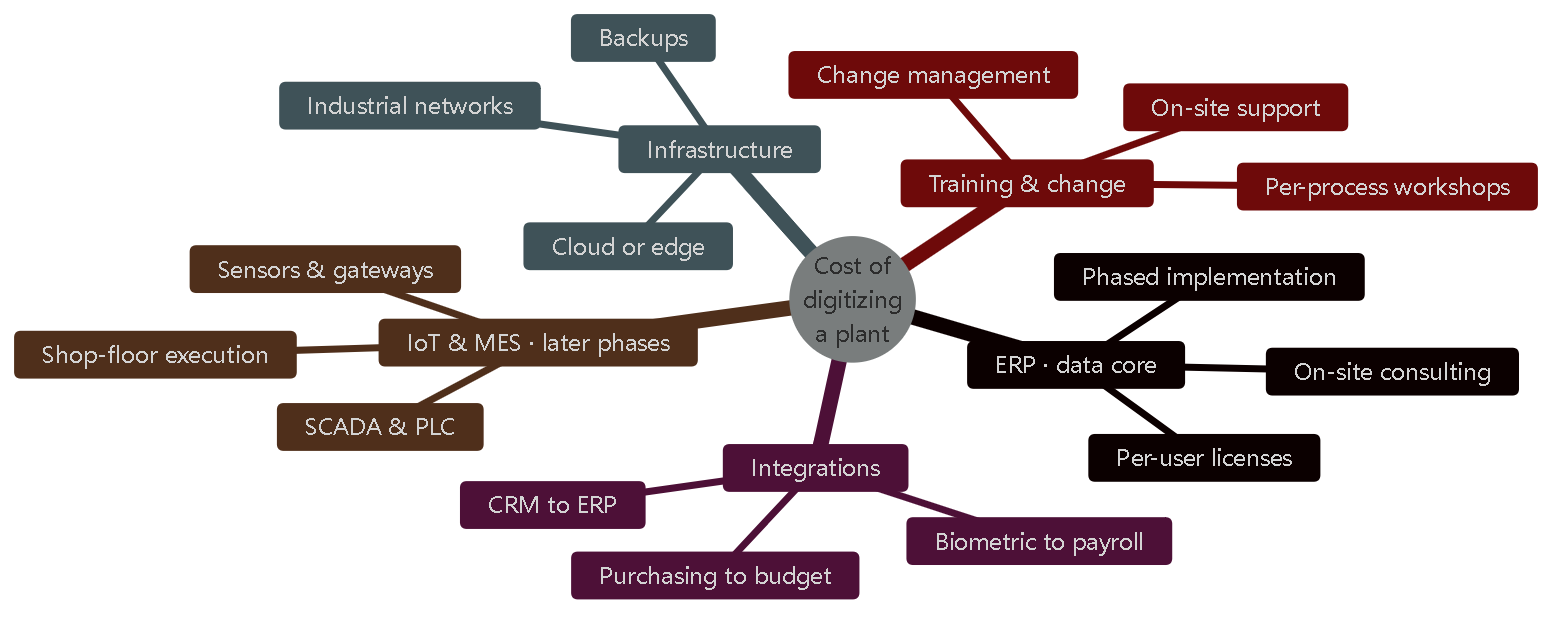
Here is the breakdown an operations director can take to their committee. The ranges are in the currency each source reports (local consulting and implementation is usually quoted in pesos; off-the-shelf industrial software, in dollars).
View Mermaid diagram
mindmap
  root((Cost of
digitizing
a plant))
    ERP · data core
      Per-user licenses
      Phased implementation
      On-site consulting
    Integrations
      Biometric to payroll
      Purchasing to budget
      CRM to ERP
    Infrastructure
      Industrial networks
      Cloud or edge
      Backups
    IoT & MES · later phases
      Sensors & gateways
      Shop-floor execution
      SCADA & PLC
    Training & change
      Per-process workshops
      On-site support
      Change management
| Layer | Typical range | Currency / unit | Scope | Source |
|---|---|---|---|---|
| ERP (Odoo, manufacturing/SME) | $100,000–$350,000 (project); Enterprise ~$84,000/year in licensing+hosting (20 users) | MXN / project and year | MX | Nuvvo, engsoluciones |
| ERP (SAP Business One) | $15,000–$150,000+ implementation; license $95–$250/user/month | USD / project and user | Global | ERP Research |
| On-site consulting (retainer) | $15,000–$30,000/month | MXN / month | MX (Transgenia model) | Anonymized case (§7) |
| System-to-system integrations | $6,000–$24,000 per integration; +10–20% per year of maintenance | USD / integration | Global | Percengage |
| Industrial IoT / sensors | $10–$500+ per sensor; plant deployment $50,000–$200,000 | USD / sensor and deployment | Global | Euristiq |
| MES (manufacturing execution) | Midsize $375,000–$600,000; SaaS from $900/month | USD / site and month | Global | Symestic |
| Automation / SCADA / PLC | Mid-scale $10,000–$100,000; HMI/SCADA software $5,000–$25,000 | USD / project and license | Global | Qviro |
| Connectivity / edge | Gateway software $5,000–$25,000/server | USD / node | Global | Ubidots |
| Training & change management | 8–15% of total budget | % of project | Global | Svitla |
Two notes of honesty about this table. First: only the ERP and on-site consulting have Mexico-specific references; IoT, MES, SCADA, and edge are reported globally in dollars because no granular published MX benchmark exists. Local integration labor is usually lower, but that is confirmed by quote, not by benchmark. Second: the "on-site consulting" row is our own model, and we explain it in depth below.
4. The right order: a phased roadmap
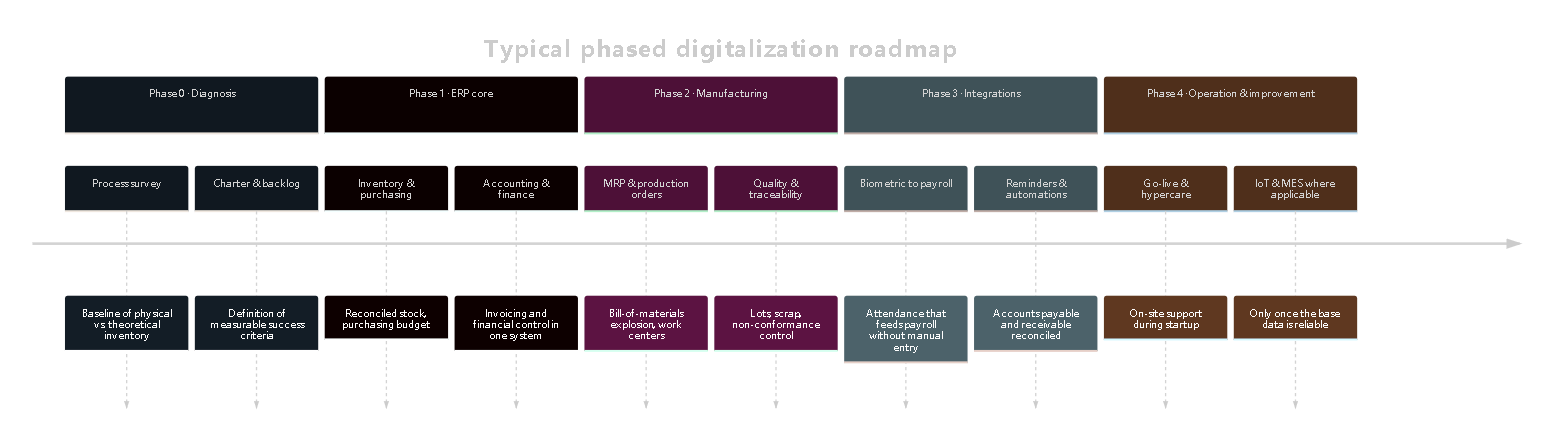
Nobody digitizes a plant in a weekend or in a single outlay. The real project we use as a reference was organized into two-week sprints over several months, and the pattern is replicable: stabilize the core before moving up a layer.
View Mermaid diagram
timeline
    title Typical phased digitalization roadmap
    section Phase 0 · Diagnosis
        Process survey : Baseline of physical vs. theoretical inventory
        Charter & backlog : Definition of measurable success criteria
    section Phase 1 · ERP core
        Inventory & purchasing : Reconciled stock, purchasing budget
        Accounting & finance : Invoicing and financial control in one system
    section Phase 2 · Manufacturing
        MRP & production orders : Bill-of-materials explosion, work centers
        Quality & traceability : Lots, scrap, non-conformance control
    section Phase 3 · Integrations
        Biometric to payroll : Attendance that feeds payroll without manual entry
        Reminders & automations : Accounts payable and receivable reconciled
    section Phase 4 · Operation & improvement
        Go-live & hypercare : On-site support during startup
        IoT & MES where applicable : Only once the base data is reliable
The financial advantage of this order is concrete: each phase can be paused. If the business needs to halt investment after stabilizing inventory and purchasing, the plant already operates better and isn't stuck halfway through a mega-project. Committing capital to MES or IoT before validating the ROI of the base layers is the most common way to spend millions with no measurable result.
5. Prioritizing: impact versus effort
Not all modules pay off equally per unit invested. This is the map we use to decide what goes first: high impact and reasonable effort in the top right; high effort with deferred impact, at the end.
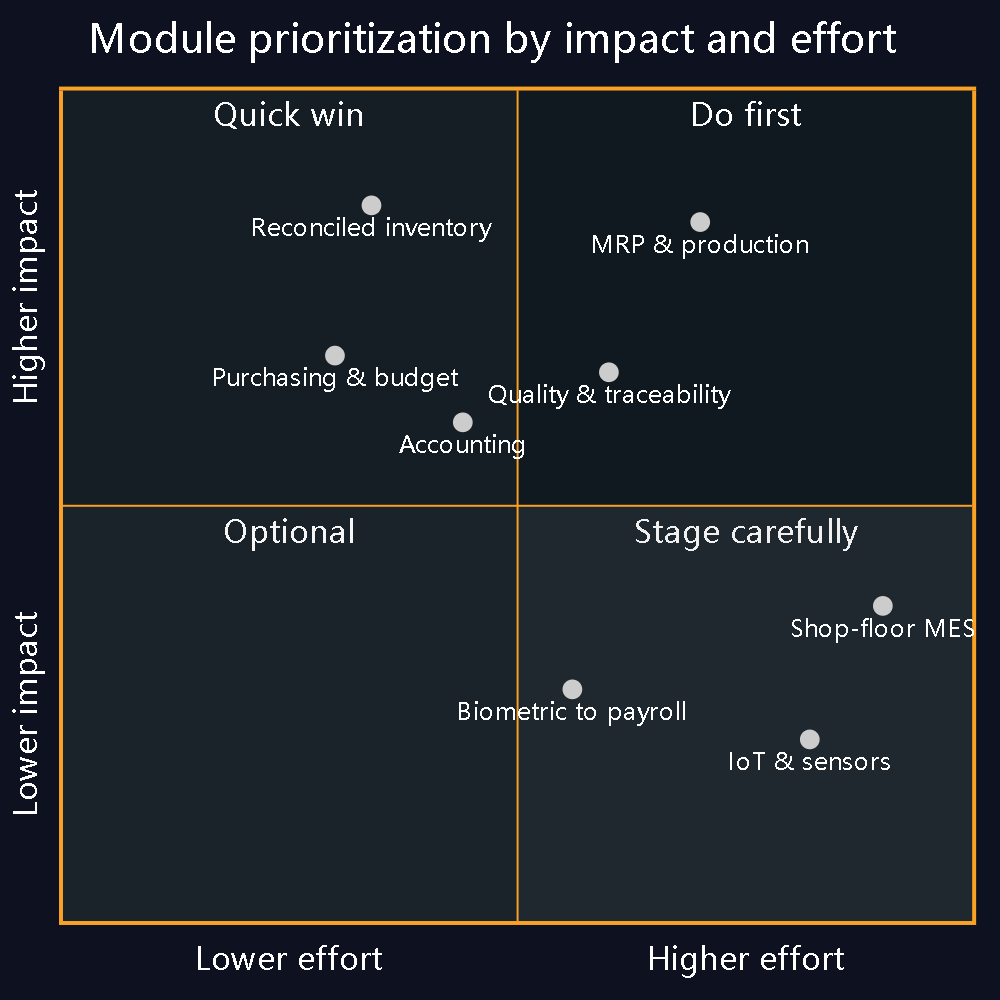
View Mermaid diagram
quadrantChart
    title Module prioritization by impact and effort
    x-axis "Lower effort" --> "Higher effort"
    y-axis "Lower impact" --> "Higher impact"
    quadrant-1 "Do first"
    quadrant-2 "Quick win"
    quadrant-3 "Optional"
    quadrant-4 "Stage carefully"
    "Reconciled inventory": [0.34, 0.86]
    "Purchasing & budget": [0.30, 0.68]
    "Accounting": [0.44, 0.60]
    "MRP & production": [0.70, 0.84]
    "Quality & traceability": [0.60, 0.66]
    "Biometric to payroll": [0.56, 0.28]
    "IoT & sensors": [0.82, 0.22]
    "Shop-floor MES": [0.90, 0.38]
6. The cost almost nobody quotes: the people
Here is the budget line that sinks projects. Technology is rarely the problem; adoption is. A flawless biometric kiosk is worth nothing if operators keep clocking in on a notebook because nobody guided them through the change.

View Mermaid diagram
flowchart LR
    A["BEFORE
Entry in Excel
and notebooks · data
that doesn't add up"] --> B["STARTUP
System is announced
resistance is normal"]
    B --> C["TRAINING
Workshops on
their own process"]
    C --> D["OPERATION
Biometric kiosk
real-time data"]
    D --> E["MATURITY
The system is
part of the job"]
    style A fill:#7c2d12,color:#fff
    style B fill:#78350f,color:#fff
    style C fill:#1e3a5f,color:#fff
    style D fill:#1e3a5f,color:#fff
    style E fill:#166534,color:#fff
In the reference project, training was structured into four theory-and-practice modules on the live system, one per day, with a workshop on real cases from the plant itself. It is not an optional expense: it is the difference between a system that gets used and one that is abandoned within three months.
7. A real, anonymized case: what was done and how it was billed
The concrete reference for this article is a plant that manufactures and distributes pallets and packaging in the State of Mexico. No names —the project is confidential—, but with the model exactly as it operated.
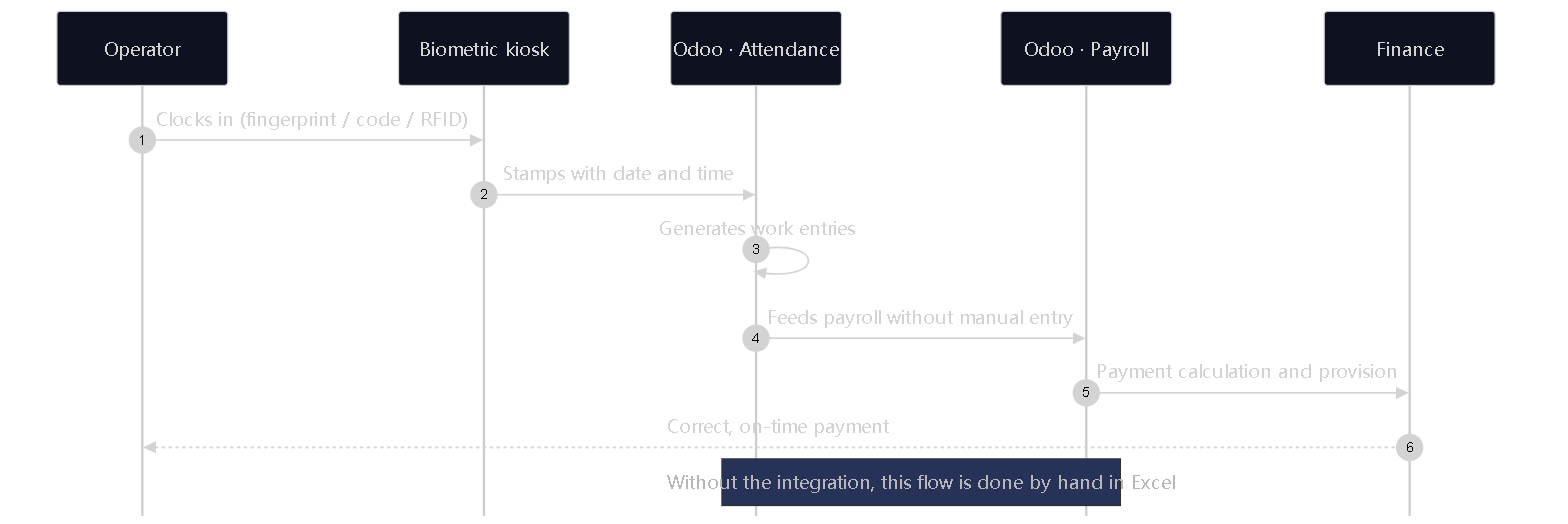
The scope was an Odoo Enterprise implementation with native configuration, no code development: inventory (top priority, to reconcile physical against theoretical stock), purchasing with a dedicated budget, MRP and production orders, accounting, quality and traceability, maintenance with plant indicators, and HR with attendance, payroll, and time off. The most illustrative integration was this one:
View Mermaid diagram
sequenceDiagram
    autonumber
    participant Op as Operator
    participant Ki as Biometric kiosk
    participant As as Odoo · Attendance
    participant No as Odoo · Payroll
    participant Fi as Finance

    Op->>Ki: Clocks in (fingerprint / code / RFID)
    Ki->>As: Stamps with date and time
    As->>As: Generates work entries
    As->>No: Feeds payroll without manual entry
    No->>Fi: Payment calculation and provision
    Fi-->>Op: Correct, on-time payment
    Note over As,No: Without the integration, this flow is done by hand in Excel
An operational lesson that saves money: not all biometric devices share their data the same way. Before promising this integration, you have to validate the hardware model case by case; assuming compatibility is one of the most common ways for a sprint to slip.
The billing model was not a single outlay but an on-site consulting retainer: a fixed monthly component (on the order of $15,000 MXN) plus a variable component tied to meeting the month's objectives, with the specialist consultant present at the plant three times a week. It is a deliberate scheme: it aligns payment with real progress and avoids the classic "turnkey" project that is billed in full and delivered half-done. For a mid-sized plant, the reasonable range for this model runs from $15,000 to $30,000 MXN per month, scaling with how many modules and how much on-site presence are needed.
8. How to decide phase by phase: the go / no-go gate
The right question is not "how much does it all cost?" but "can we —and should we— move up to the next layer yet?" This is the gate we apply before every phase.
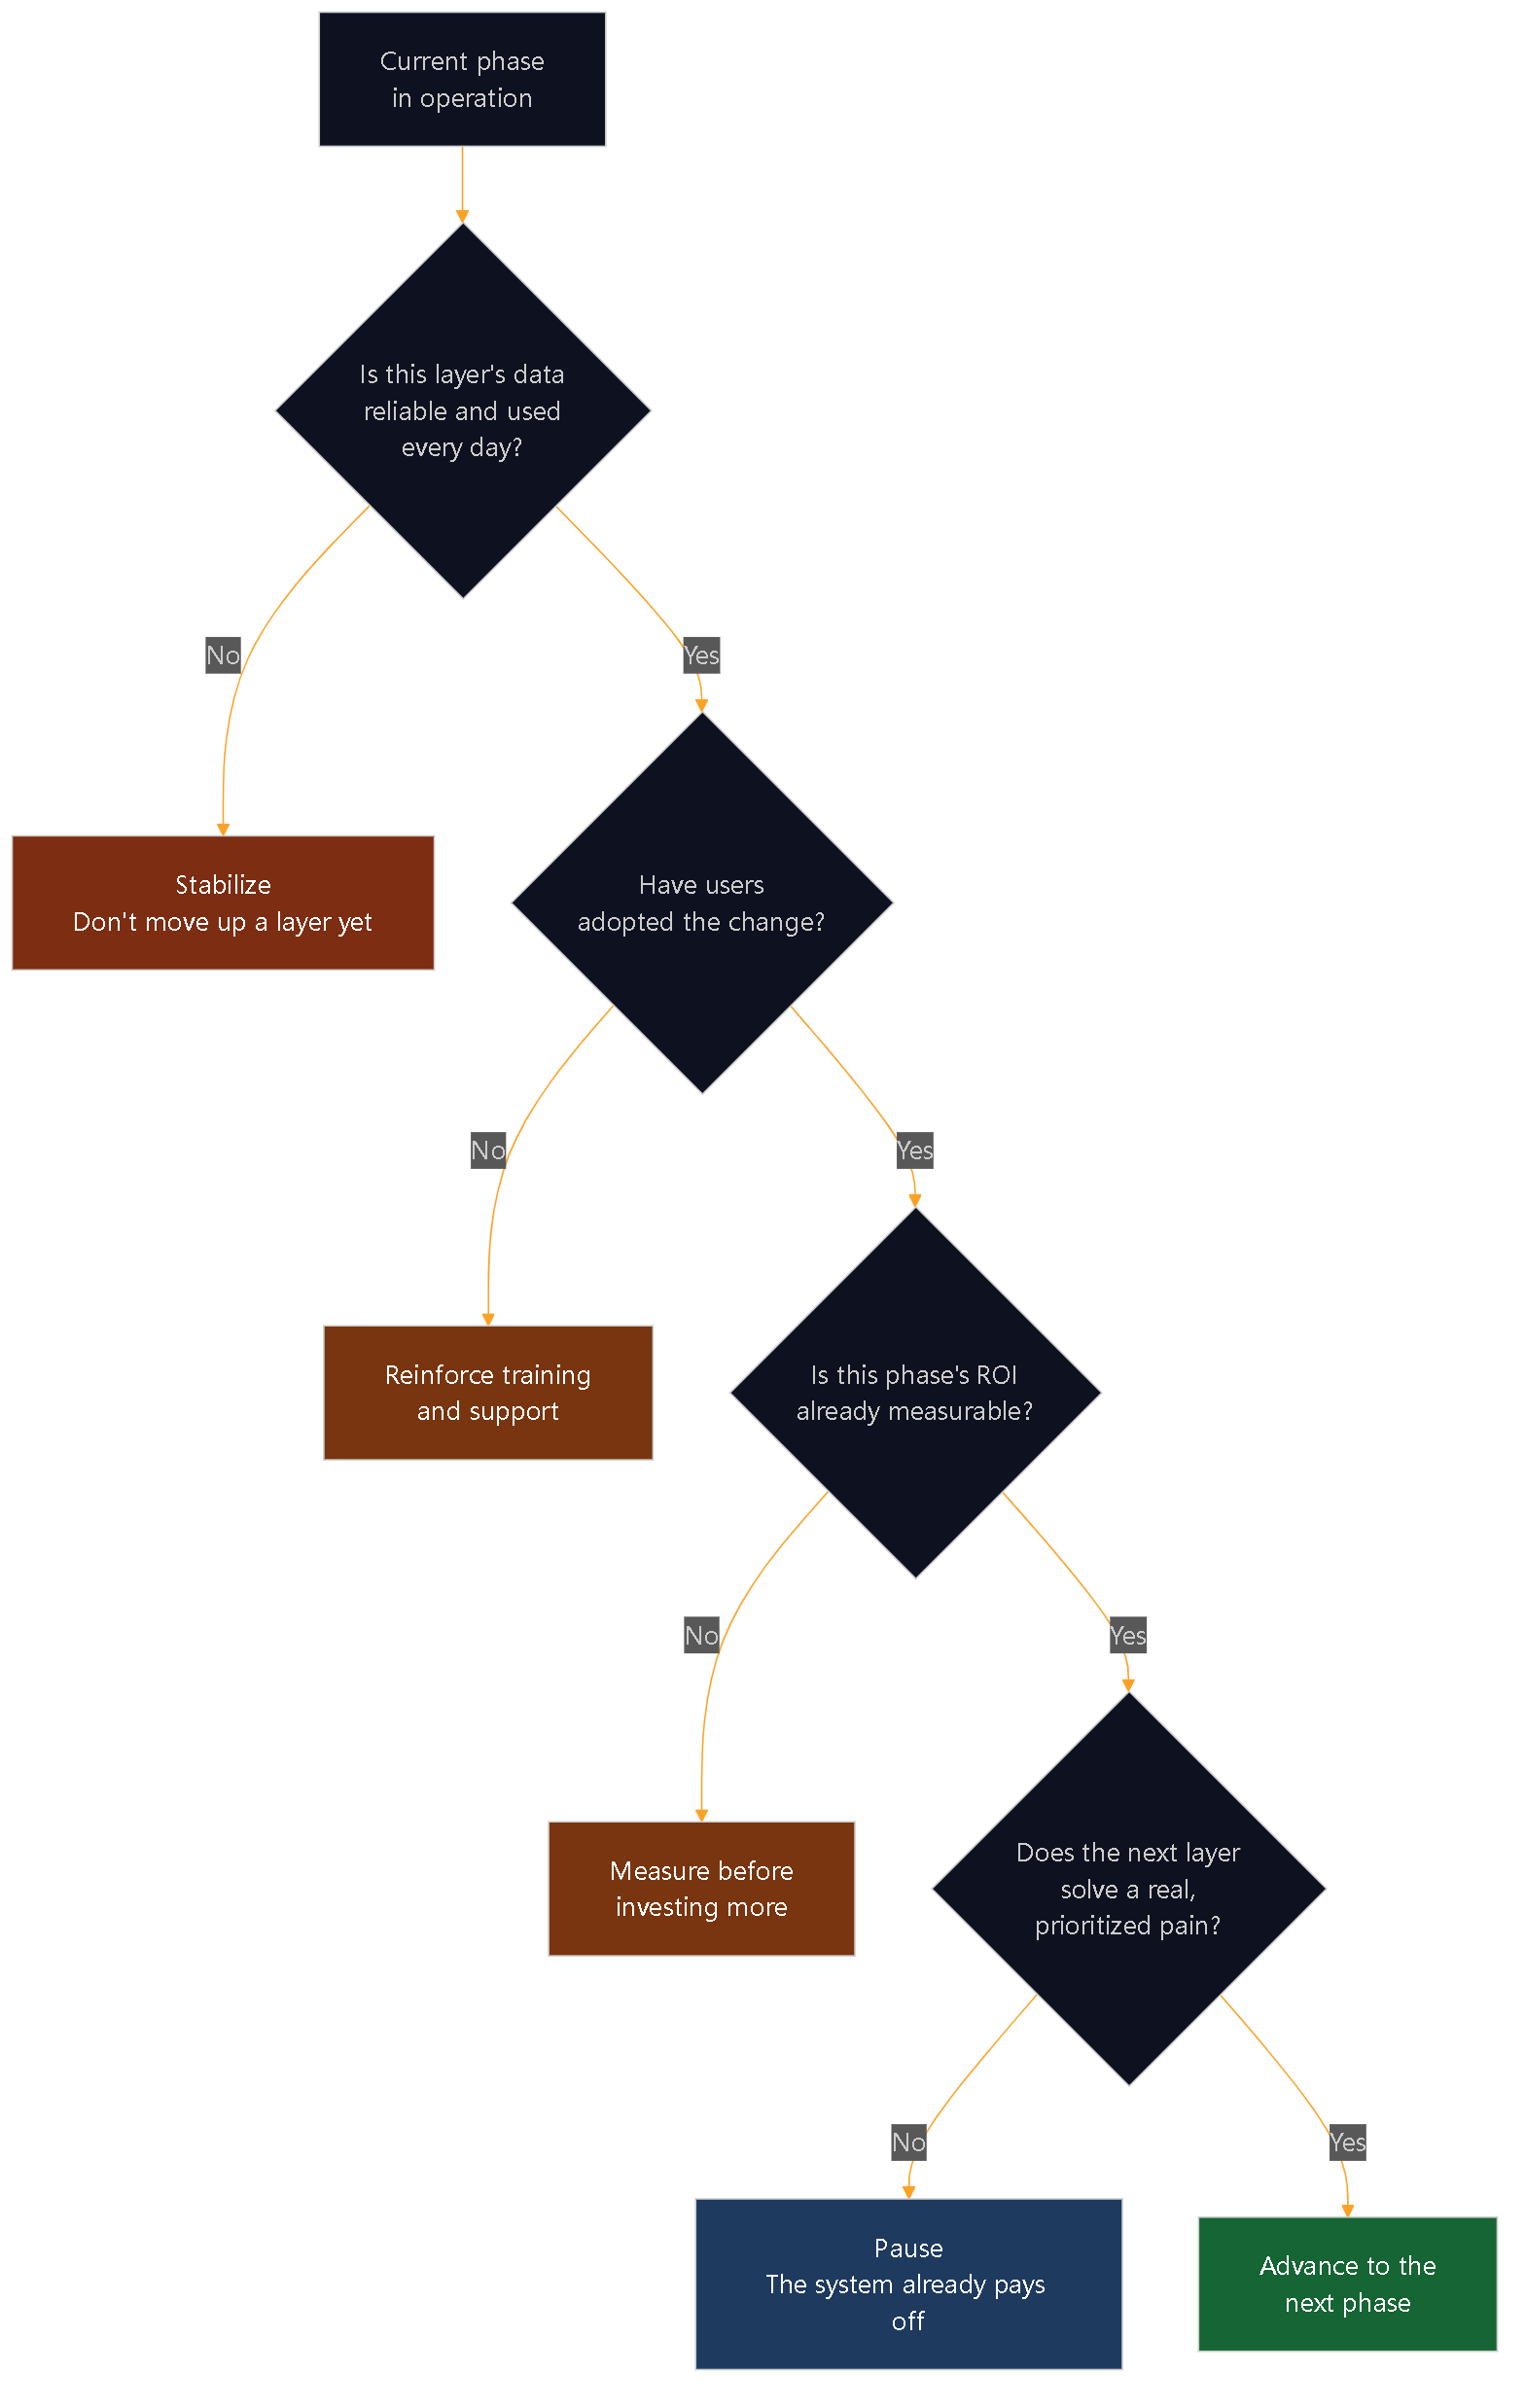
View Mermaid diagram
flowchart TD
    F0["Current phase
in operation"] --> Q1{"Is this layer's data
reliable and used
every day?"}
    Q1 -->|"No"| E1["Stabilize
Don't move up a layer yet"]
    Q1 -->|"Yes"| Q2{"Have users
adopted the change?"}
    Q2 -->|"No"| E2["Reinforce training
and support"]
    Q2 -->|"Yes"| Q3{"Is this phase's ROI
already measurable?"}
    Q3 -->|"No"| E3["Measure before
investing more"]
    Q3 -->|"Yes"| Q4{"Does the next layer
solve a real,
prioritized pain?"}
    Q4 -->|"No"| E4["Pause
The system already pays off"]
    Q4 -->|"Yes"| GO["Advance to the
next phase"]

    style E1 fill:#7c2d12,color:#fff
    style E2 fill:#78350f,color:#fff
    style E3 fill:#78350f,color:#fff
    style E4 fill:#1e3a5f,color:#fff
    style GO fill:#166534,color:#fff
9. So, how much does it cost?
The honest answer is a range with conditions, not a single figure. For a mid-sized industrial plant in Mexico:
- ERP core (Phases 0–1), Odoo: implementation on the order of $100,000 to $350,000 MXN, plus annual licenses; or else an on-site consulting retainer of $15,000 to $30,000 MXN/month that spreads the cost and ties it to progress.
- Integrations (Phase 3): on the order of $6,000 to $24,000 USD per integration, plus 10–20% per year of maintenance for each one.
- IoT / MES / automation (Phase 4, where applicable): here the figures jump to tens or hundreds of thousands of dollars, all the more reason not to reach this layer before the earlier ones pay off.
- Training and change management: always reserve 8–15% of the total. It is the item that decides whether everything else gets used.
The practical conclusion: digitizing is not a purchase, it is a staged investment that can —and should— be paused between phases. The biggest savings come not from negotiating the price of the software, but from not committing capital to layers that don't yet have anything to stand on. A peso invested in reconciling inventory pays off more than ten pesos on sensors measuring a process nobody controls yet.
Let's talk about your plant
If you are evaluating whether to digitize your operation and want a cost-per-module and phased-timeline breakdown for your specific case —not a generic quote— that is exactly what we do. We start with a diagnosis that pins down which layer suits you first, with measurable success criteria before you commit a single peso to technology.
Write to us at carreon.efrain@transgenia.org and/or book a 15-minute QuickLook with us at calendly.com/saurat-xiuhcoatl/min15, or learn about our approach for the industrial sector. We'll return a phased map, with real cost ranges, so the decision is yours and it's an informed one.
Transgenia implements and operates Odoo with governed AI agents, and supports the phased digitalization of industrial operations. Write to us at carreon.efrain@transgenia.org or book a QuickLook · Privacy notice